

| Profit Recap for Week Ending |
Sunday, December 9, 2018
|
|---|
This week marks a full year since the start of the $2500 account challenge and it ended with success despite a bloody red market. With the US and China agreeing to a pause in additional tariff increases until an agreement can be reached within 90 days, the market staged a nice gap up on Monday punching through the 50 and 200 daily moving averages pre market only to fall by the day's end. On Tuesday the selling continued heading into Wednesday, a day of mourning in which the markets closed. Thursday was the first TRUE attempt to lift he market once more with huge buying volume after a morning gap down. But the week ended back in the red as confidence in achieving a trade agreement between the US and China was shaken.
For this week, we had 13 Launches with 8 winners $AQUA $AMPH $NTRA $VCEL $IMMU $STL $BRX and 5 losers $FNSR $TPH $COOP $STML $WBT. Accuracy was at 62% and the Profit to Loss Ratio was 140% .
This week marks the conclusion of the $2500 challenge. No more Launch lists will be published the rest of this year as we take time to relax, watch the down trending markets and prepare for 2019.

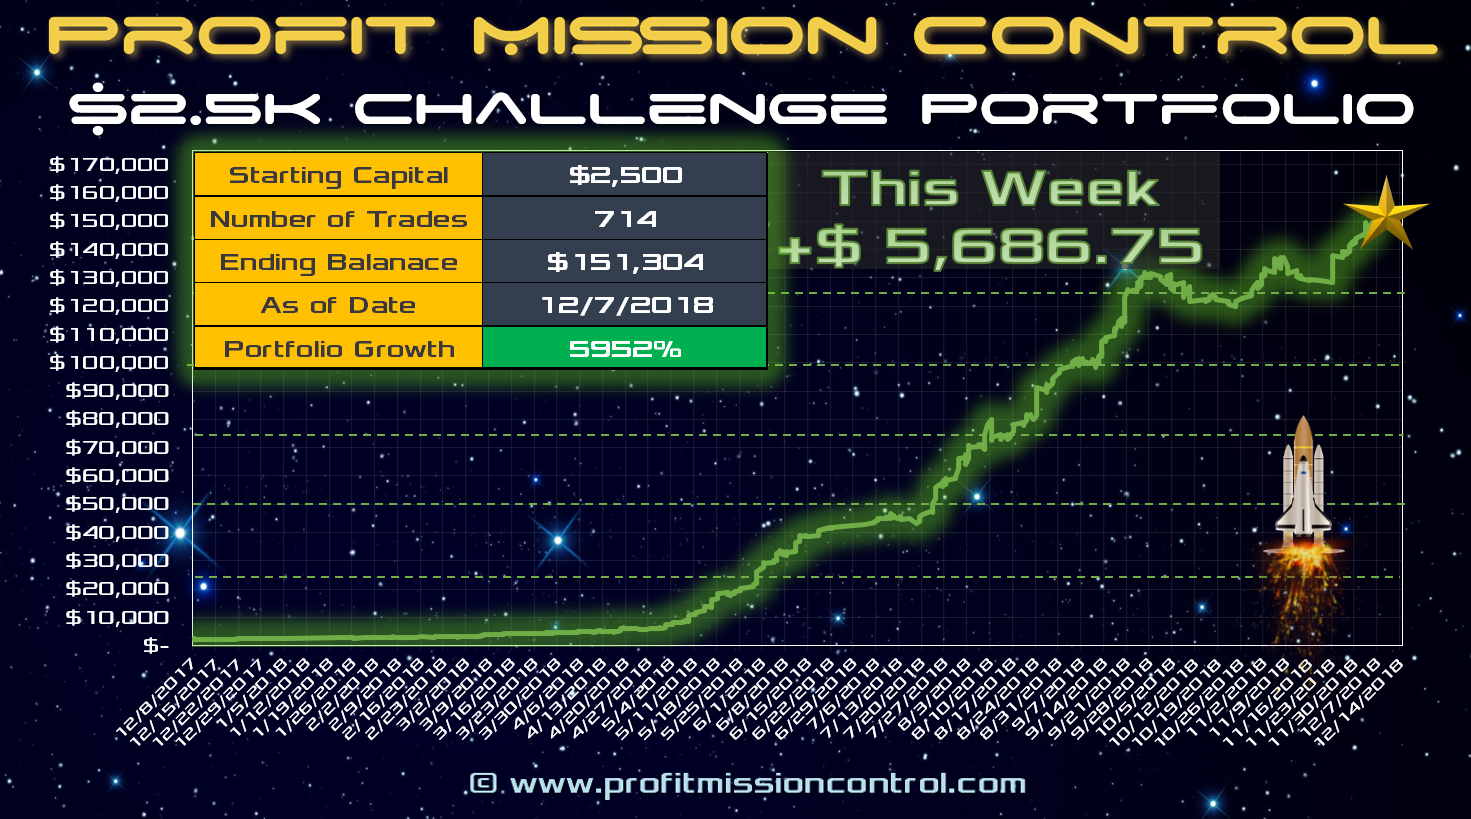
Weekly Portfolio Growth Summary
The chart below captures the cumulative portfolio profit growth on a weekly basis since the start of the $2500 challenge where we trade a variable number of shares per launch. This chart only contains the trades that are launched based on the Launch List published on the site. The profit growth does not include intraday day calls from our intraday alerts. The portfolio growth is based on actual entries and exits from the Launch List that are published on the site, StockTwits, Twitter and Facebook . Our goal here is to track our Launch List system profits based on transparent Launch plans that are published 2-5 times a week.
For this week, the portfolio added another $5,686.75 with the portfolio reclaiming a new high of the year to a total sum of $151,304.
Weekly Performance Growth Summary
Here is the latest update to the $2500 Launch List Performance Card. Since the start on 12/8/2017 we completed 714 Launches, 65.8% Accuracy with an average Profit/Launch of $0.23/Launch. On a per share basis for the challenge start to date the Profit per Share was $137.44/Share. If you multiply that Profit Per Share times the average number of shares per trade (currently sitting at about 1466 shares), that will give you the total approximate profit on the challenge so far. Overall Profit/Loss ratio was 104.71% and the Overall profit factor is 2.00 to date.
